
How it fits your plan
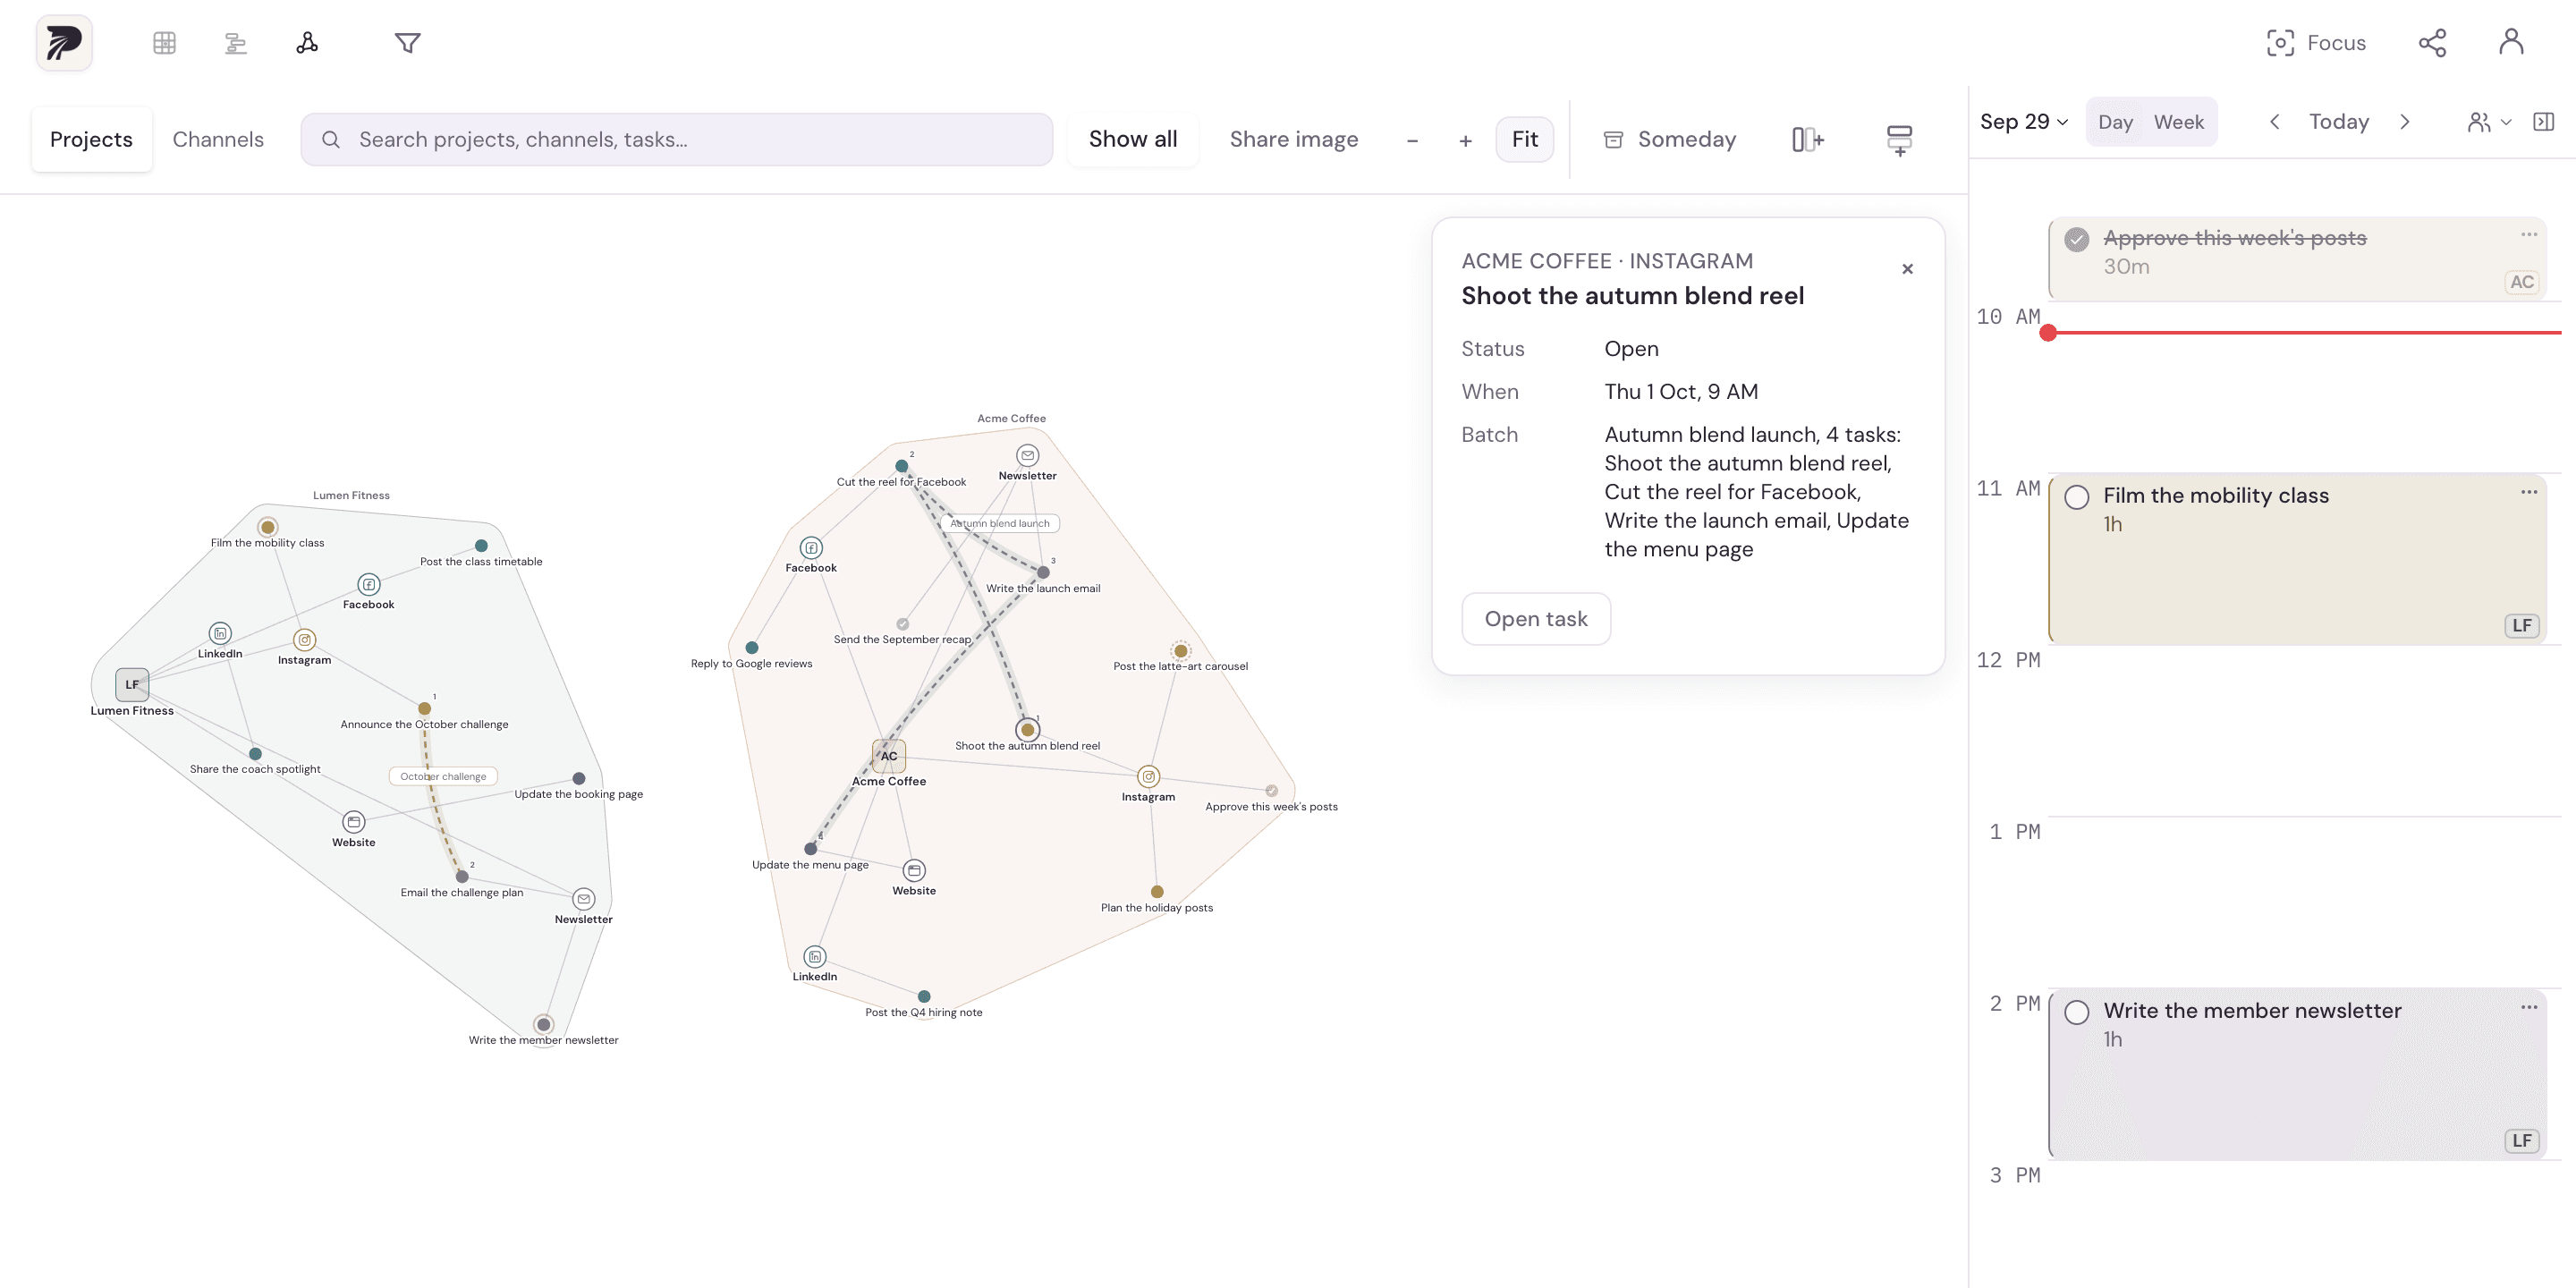
Overview shows the matrix and day calendar. Timeline shows upcoming work across projects. Graph shows the relationships between projects, channels, tasks and linked batches.
A concrete example
The three Friday writing tasks are visible in their matrix cells, in their scheduled day, and as a connected batch in Graph. Changing perspective helps answer a different question without maintaining another planning system.
Put it into practice
Use Overview to place the work
Start with projects and channels. Add tasks, connect related work and schedule the next useful session.
Read what's coming in Timeline
Inspect upcoming work by project and expand the detail you need. Look for unscheduled items and crowded days before making new commitments.
Follow relationships in Graph
Find a project, channel or task, then inspect the connected work. Named batches make related task membership visible.
Return to the plan to act
Use the view that answers the current question, then adjust the work in the planner. These views share the same underlying workspace.
A few details to keep in mind
- The visualizations organize the work already in your workspace; they do not infer a project dependency or approval process.
- Keep project and channel names readable so each view remains useful as the workspace grows.